295Trades
38%Win rate
+0.70%Avg per trade
1.35Profit factor
+£204Profit, £100 a trade
5 of 5Years profitable
Breakouts are the oldest idea in technical trading: when a share pushes above a recent high on heavy volume, buy it and let the move run. The trouble is that most breakouts fail. Price pokes above the line, the buyers run out, and it slides back. This strategy applies the idea to 28 American commodity producers (oil majors, gold miners, steelmakers and fertiliser firms) and adds one rule to deal with the failures: if the breakout has not held by the close, get out at the next day’s open.
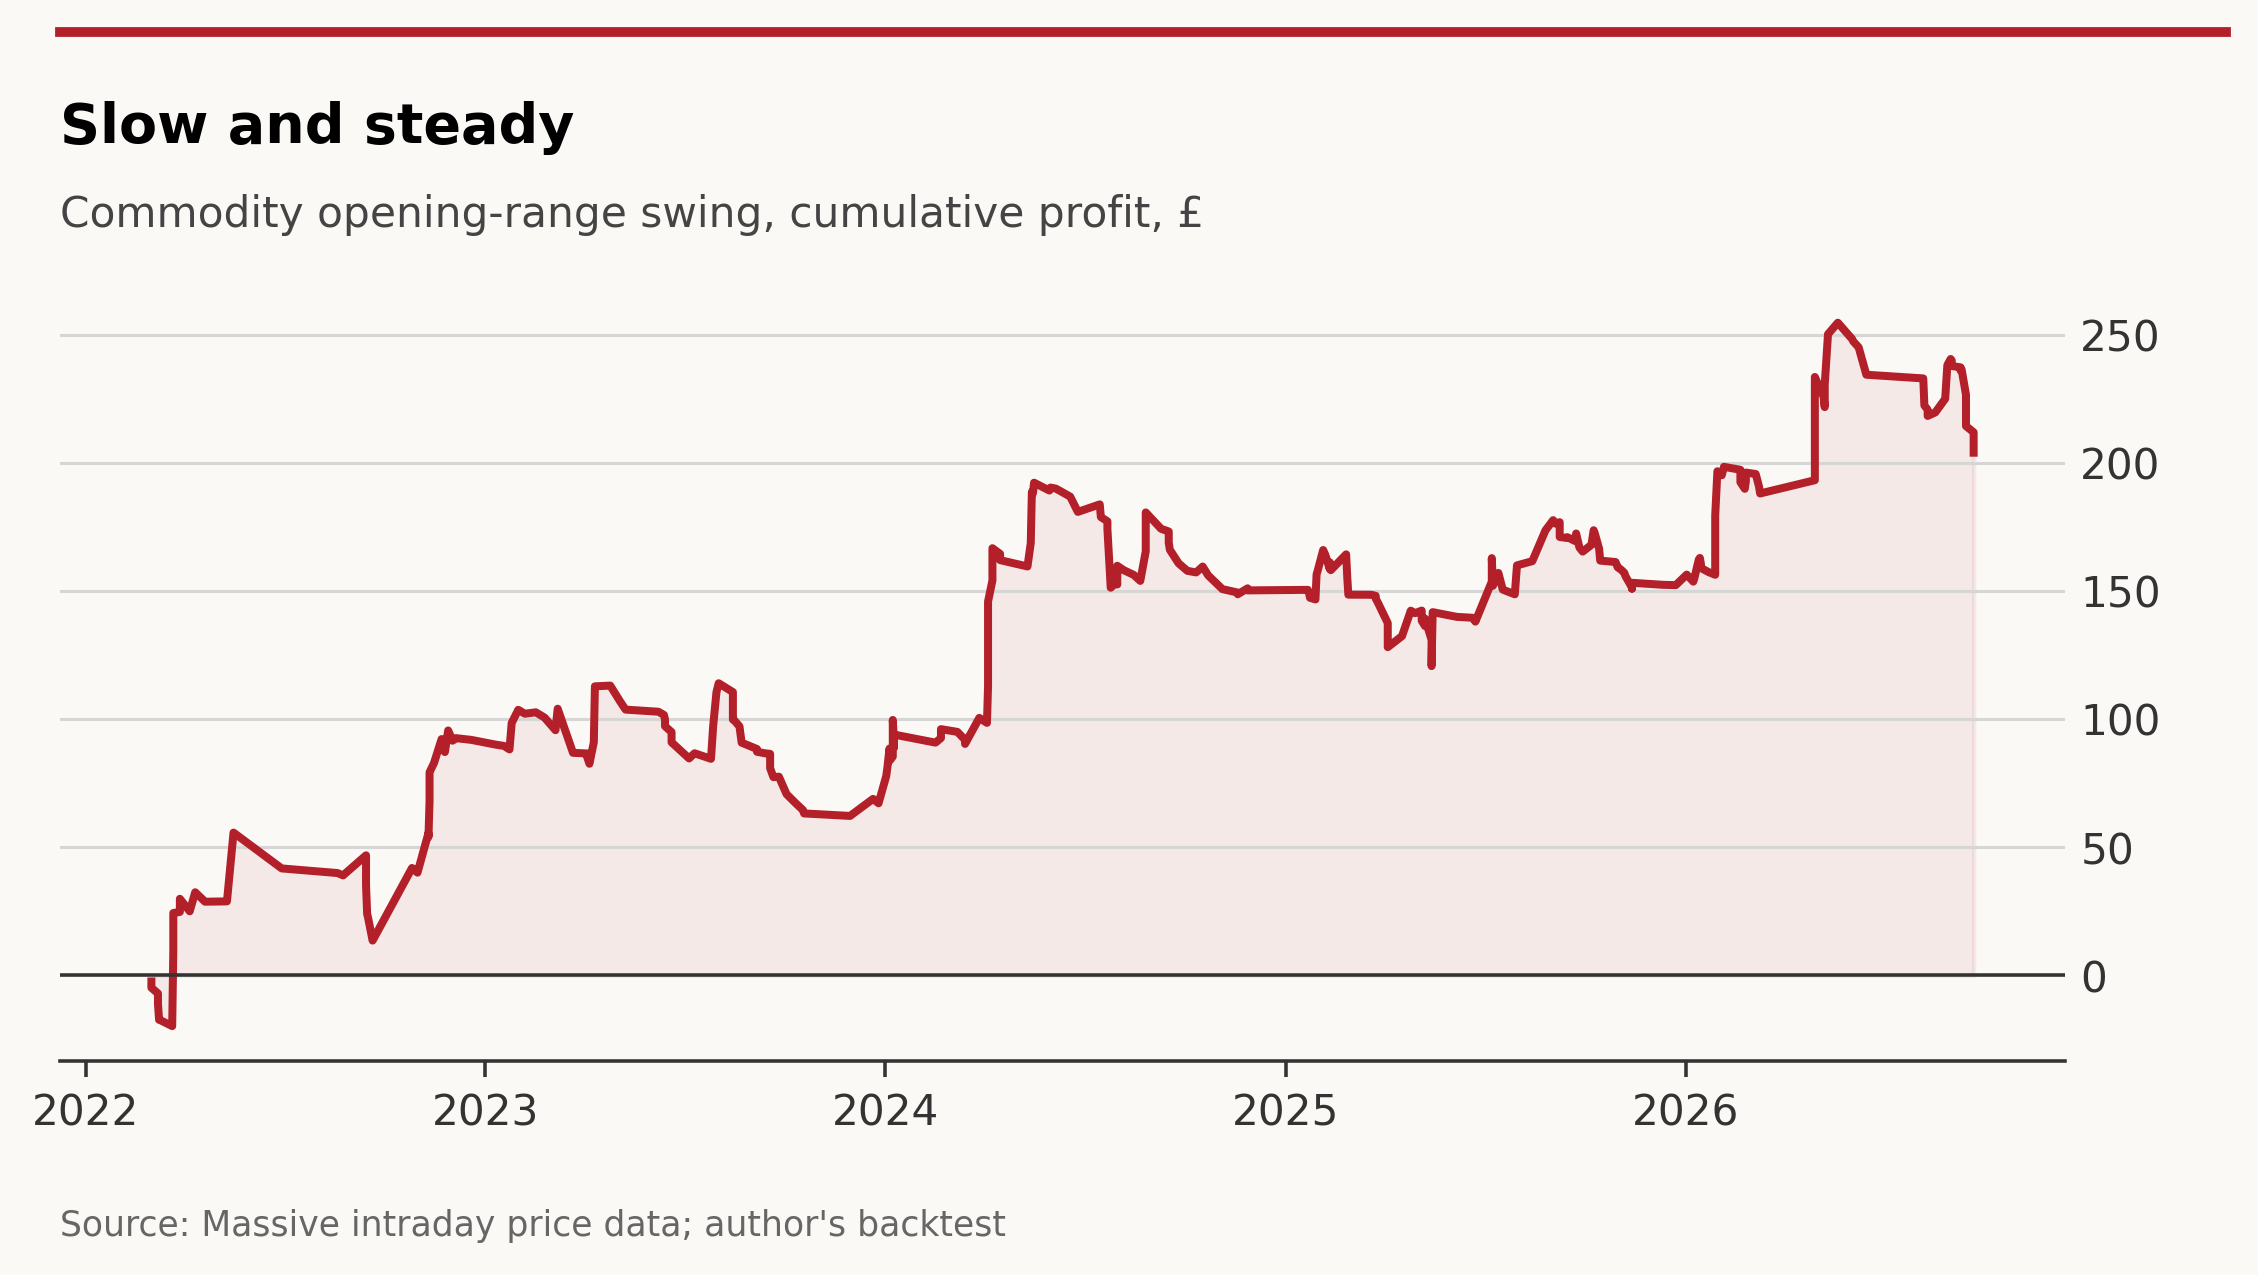
That rule costs some profit but cuts the worst drawdown by almost two-thirds. Across 295 trades since March 2022, the strategy made money in every calendar year, with a worst drawdown of £84 on £100 positions.
Long only, entries between 9.30am and 10am New York time, at most one per share per day.
The universe is fixed in advance: XOM, CVX, COP, OXY, DVN, EOG, APA, SLB, HAL, MPC, VLO and PSX in energy; NEM, AEM, WPM and KGC in precious metals; FCX, SCCO, AA, CLF, NUE and STLD in base metals and steel; MOS, CF, NTR, ADM, BG and CTVA in agriculture. Positions are £100, in fractional shares, with Interactive Brokers’ tiered costs.
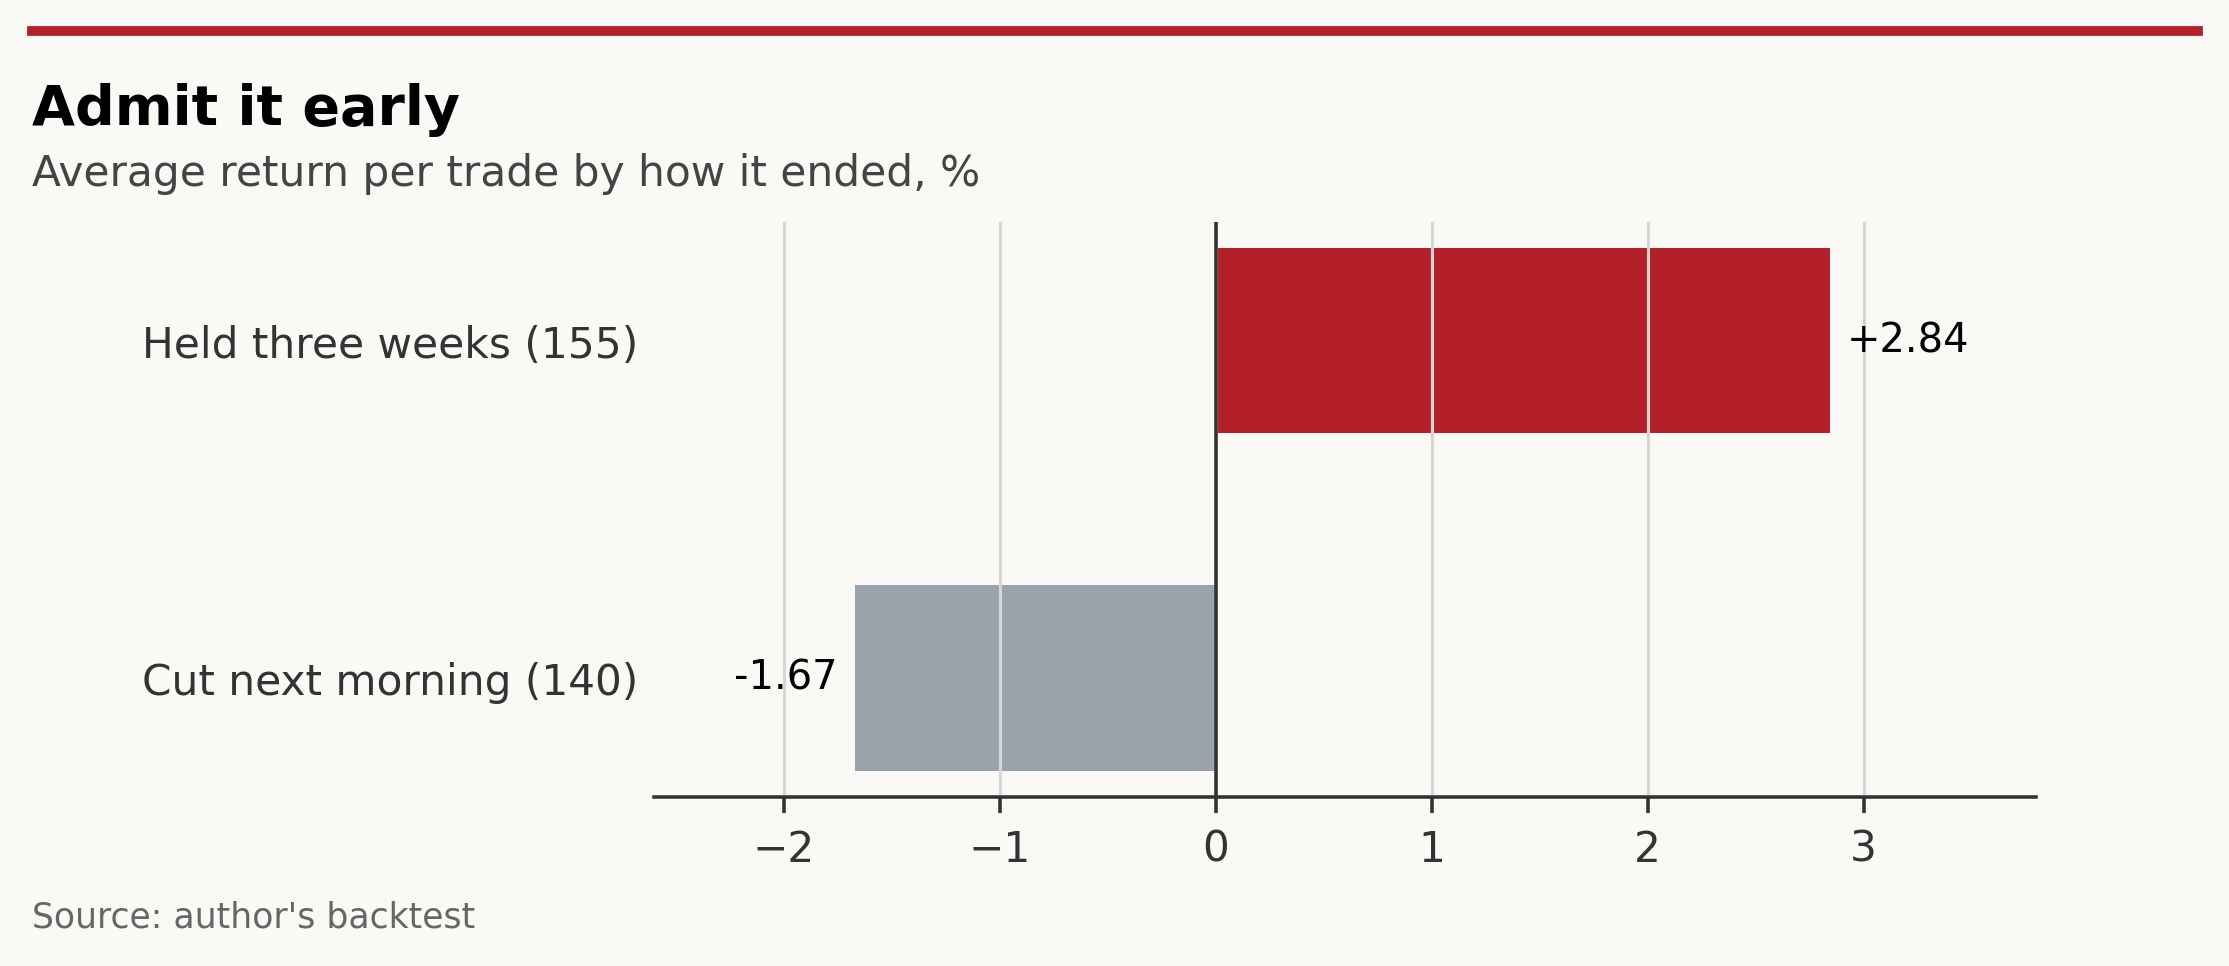
The failed-breakout rule does most of the work. Nearly half of all trades (140 of 295) are cut the next morning, losing -1.67% on average. The 155 that survive the first day make +2.84%.
That makes the strategy psychologically awkward. Its win rate is just 38%: most trades are small losses, and the profit comes from fewer, larger winners. It needs the discipline to take a string of small cuts without abandoning the rules.
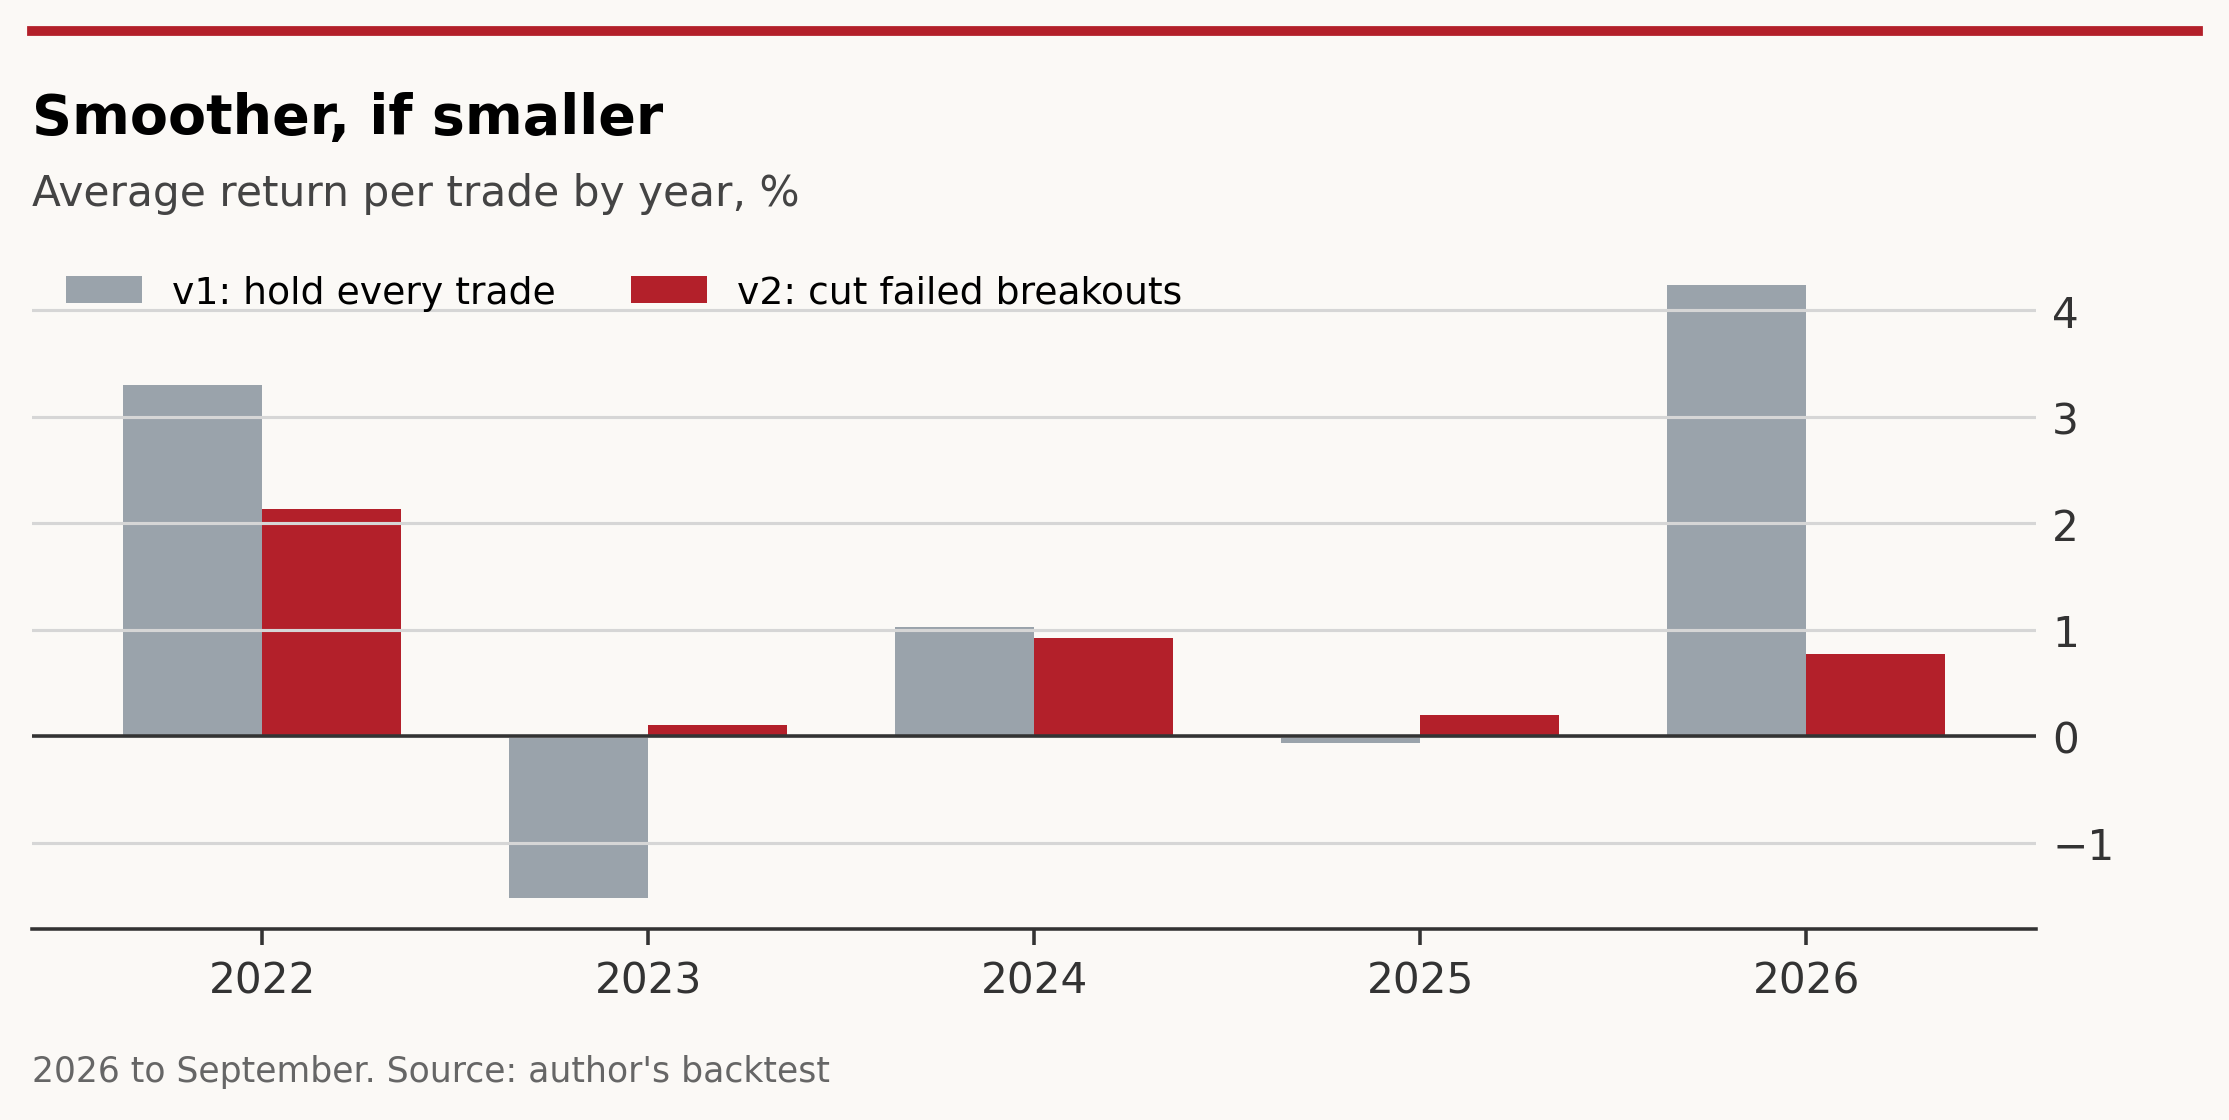
The first version had no failed-breakout exit and simply held every trade for three weeks. It made more money in total, but it was a rougher ride and relied on two good years.
| v1: hold every trade | v2: cut failed breakouts | |
|---|---|---|
| Trades | 291 | 295 |
| Win rate | 55% | 38% |
| Average per trade | +1.03% | +0.70% |
| Profit factor | 1.32 | 1.35 |
| Total profit | +£300 | +£204 |
| Worst drawdown | −£230 | −£84 |
| Profit ÷ worst drawdown | 1.3 | 2.4 |
| Profitable years | 3 of 5 | 5 of 5 |
The comparison also tests a worry about v1: most of its profit came in 2022 and 2026, both strong years for commodities. Version 2 did better before 2025 (0.91% a trade) than after (0.44%), so it does not simply ride the recent rally.
Several tempting improvements were tested and rejected. Holding for four to eight weeks looked better overall, but all of the gain came after 2025. Trend filters (price above its 50- or 200-day average, or the S&P 500 above its 200-day average) either cut returns or worked in only one half of the data. Loosening the volume rule to 1.5 times normal doubled the number of trades but diluted the edge. And shorter holds lose money: at one day, three days or a week the strategy breaks even at best.
Costs are critical at this size. On Interactive Brokers’ tiered pricing a round trip costs about 0.5%; on fixed pricing, with its $1 minimum, it is about 1.5% and the edge disappears. Profit is also concentrated: 16 of the 28 shares were profitable, and trimming the list to the winners would simply fit the backtest to the past. The holding period is noisy too; 20 days did worse than both 15 and 30. The next step is paper trading, including a check that fractional-share buy-stop orders fill as the backtest assumes.
Hypothetical backtest, March 2022 to September 2026. Not investment advice. Past performance is not a reliable guide to future results. See the disclaimer.